This guide no longer works, a rewrite is planned
Installation
The Elastic stack has several components that each have their own installation guides.
Install Elasticsearch
This guide is adapted from the official guide and the guide written by Frankline Bett.
Install from APT repository
The elastic APT repository is installed by default on Kali Purple, run the following command to install elasticsearch
sudo apt install elasticsearchConfigure Elasticsearch
Open the configuration file…
sudo nano /etc/elasticsearch/elasticsearch.ymlAnd set the following options:
cluster.name: kali-puprle
network.host: 0.0.0.0
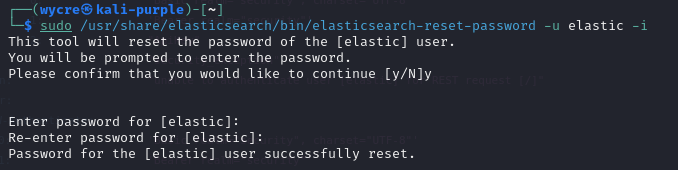
http.port: 9200Set the default user’s password:
sudo /usr/share/elasticsearch/bin/elasticsearch-reset-password -u elastic -i
Start Elasticsearch
sudo systemctl daemon-reload
sudo systemctl enable elasticsearch.service
sudo systemctl start elasticsearch
Test that Elasticsearch is running
sudo curl --cacert /etc/elasticsearch/certs/http_ca.crt -u elastic https://localhost:9200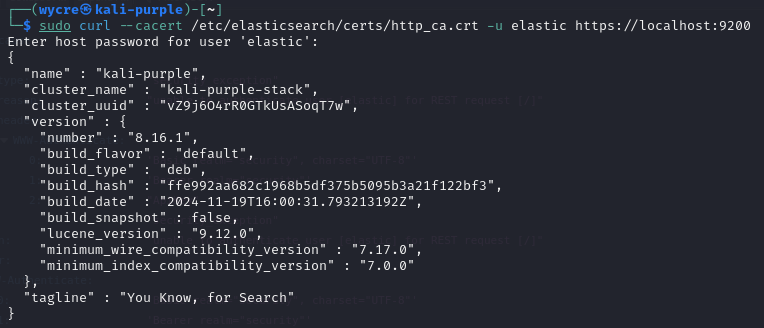 This result means that Elasticsearch is fully functional
Install Logstash
Install from APT repository
sudo apt install logstashConfigure Logstash
Create the config file /etc/logstash/conf.d/beats.conf with the following content.
input {
  beats {
    port => 5044
  }
}
filter {
  if [type] == "syslog" {
     grok {
        match => { "message" => "%{SYSLOGLINE}" }
  }
     date {
        match => [ "timestamp", "MMM  d HH:mm:ss", "MMM dd HH:mm:ss" ]
     }
  }
}
output {
  elasticsearch {
    hosts => ["127.0.0.1:9200"]
    index => "%{[@metadata][beat]}-%{+YYYY.MM.dd}"
  }
}
Start Logstash service
sudo systemctl enable logstash.service
sudo systemctl start logstash
Install Beats
To gather data, we will set up Filebeat, Metricbeat, and Packetbeat.
Filebeat
Install from APT repository
sudo apt install filebeatConfigure Filebeat
Open /etc/filebeat/filebeat.yml and make the following changes:
- Comment out all lines in the “Elasticsearch output” section
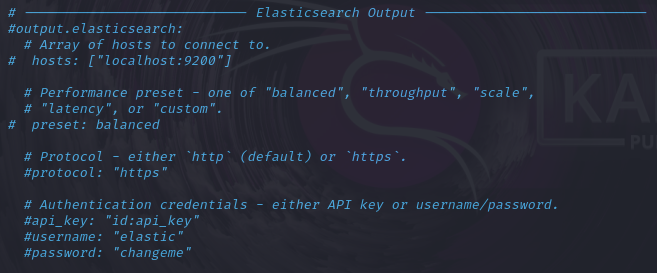
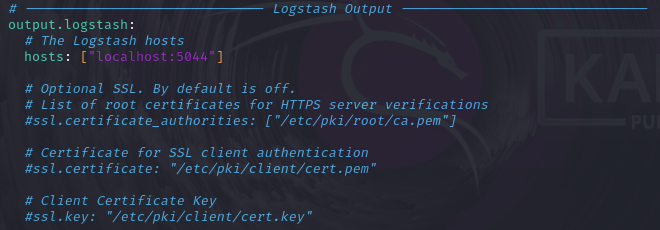
- Uncomment the lines for “Logstash output”
- Set the “Filebeat inputs” section ‘enabled’ flag to
true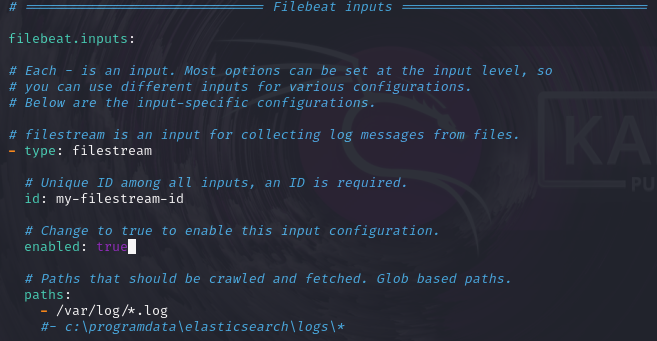
- Save and close the file
Start Filebeat service
sudo systemctl enable filebeat
sudo systemctl start filebeat
Metricbeat
Install from APT repository
sudo apt install metricbeatConfigure Metricbeat
Open /etc/metricbeat/metricbeat.yml and make the following changes:
- Comment out all lines in the “Elasticsearch output” section
- Uncomment the lines for “Logstash output”
Start Metricbeat service
sudo systemctl enable metricbeat
sudo systemctl start metricbeat
Packetbeat (TODO: Reassess)
Install from APT repository
sudo apt install packetbeatConfigure Packetbeat
Open /etc/packetbeat/packetbeat.yml and make the following changes:
- Comment out all lines in the “Elasticsearch output” section
- Uncomment the lines for “Logstash output”
Start Packetbeat Service
sudo systemctl enable packetbeat
sudo systemctl start packetbeat
Install Kibana
Install from APT repository
sudo apt install kibanaConfigure Kibana
Open the configuration file /etc/kibana/kibana.yml and ensure the following configuration values are set:
server.port: 5601
server.host: "0.0.0.0"
Start Kibana Service
sudo systemctl enable kibana.service
sudo systemctl start kibana
Access Kibana Web Interface
- Get the Kibana enrollment token:
sudo /usr/share/elasticsearch/bin/elasticsearch-create-enrollment-token -s kibana- Copy the output of the command
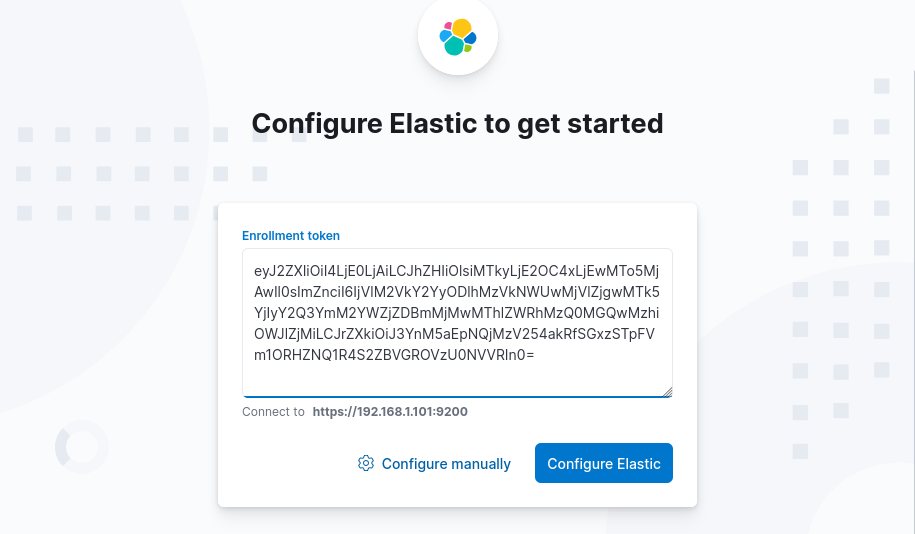
- Open the Kibana web interface at http://localhost:5601
- Paste the enrollment token and click “Configure Elastic”
- To get the code from the verification code run:
sudo /usr/share/kibana/bin/kibana-verification-code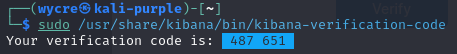 6. Wait for the configurations to complete
7. Select “Explore on my own”
8. Enable beats modules
6. Wait for the configurations to complete
7. Select “Explore on my own”
8. Enable beats modules
sudo filebeat modules enable system
sudo metricbeat modules enable logstash